Saturday, May 22, 2010

A Promise Made…

A HUGE thank you to all who attended my presentation of the Versatile Company’s “Essentials” webinars on May 20th. There were many great questions and requests, one of which I am fulfilling here - creating a custom field with a graphical indicator.

In this post we will create the baseline checker that was demonstrated in the webinar. The field we’ll customize is “Text1”, and we will assign graphical indicators to show the results of the check for each task. (Click on any image in this posting to examine the detail being shown.)

1 custom_fields

Step 1: Insert the field to be customized. In the Gantt Chart view click on the column heading where you wish to insert the new field, then press the Insert (Ins) key on your keyboard. The “Column Definition” dialog box will appear. In this dialog box find the “Text1” field in the “Field Name:” drop down list and select it. Click on the “OK” button. Your “Text1” field should now be visible.

A field name should reflect its purpose. In this example, the field name “Text1” becomes “Baseline?” indicating whether each task is baselined or not.

Step 2: Rename the field and create the formula. Click on the “Tools” menu and choose “Customize”, then “Fields…”

The “Custom Fields” dialog box will be offered.

2 Custom_field_and_formula

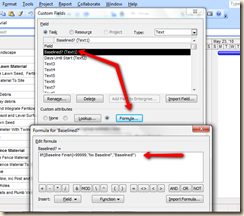
Ensure that the “Text1” field is selected and then click on the “Rename…” button and rename the field to “Baselined?”. Click on the “OK” button.  Next click on the “Formula…” button and enter the formula exactly as seen in the image above. This is the formula that returns the state of each task’s baseline. Each non-summary task should now have either “Baseline!” or “No Baseline!” in the new “Baselined?” field, depending on its state..

Step 3: Create graphical indicators.

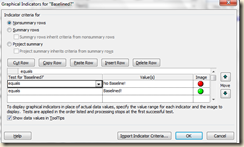
Click on the “Graphical Indicators…” button to match indicators to the results of the formula. Enter the data needed exactly as seen in the image below.

3 Indicators

Click on the “OK” button. Do the same for the “Custom Fields” dialog box. You’re done! Now the baseline state is visible and easy to evaluate.

Once you get the hang of custom fields and graphical indicators, you can dramatically reduce the time needed in your projects for analysis.

As always, let me know how you did and if you have any suggestions for future topics!

Saturday, May 15, 2010

QUICK TIP: LINE UP GANTT BARS WITH THEIR TASK NAMES

Here’s an old tip that might just save you time and confusion, and it’s incredibly easy too!

The problem: the Task Name is on one side of the screen and the Gantt bar is on the other. In order to match the bar with the name, you wind up scrolling the Gantt, sometimes overshooting the bar or even losing the Gantt entirely to the timeline. See below and click on the image to enlarge it.


The answer: Format the Gantt with lines that keep the names in alignment with the bars. From the menu in Project 2007 choose Format then choose Gridlines. The “Gantt Rows” are what need to be formatted, so click on that item, the line is solid and unbroken and the color is Silver. See below and click on the image to enlarge it.


When you click on OK, the Gantt will have lines keeping the text aligned with the bar.


Try this solution and see if it doesn’t make it just a little easier to work in Microsoft Project. Then tell me what you think about it!

Saturday, May 8, 2010

Team Planner - A Cool New Tool for Assigning Work

One of the most frequent questions I am asked about MS Project 2010 is "Are there any cool features you can tell me about?". The answer, of course is "YES!". There are so many cool new features that in the next few months there will be hundreds of articles, books and training manuals created that will show every feature. The question that I hope to answer is "What are the cool new USEFUL features?".

Now that 2010 has been released to manufacturing and production, I will give you my opinions on new features and how you might use them. There are two that leap out at me that are game changers: Manual Scheduling and the Team Planner.

Manual Scheduling allows you to create and schedule tasks and resources without the interference of MS Project's scheduling engine. This means that Project won't be second guessing the starting and ending dates when you enter a task.

The Team Planner works with Manual Scheduling to allow you to assign tasks to a resource in a timeline. The Team Planner also shows work assigned to other resources. Work is assigned and moved by clicking and dragging it to the time period you want.

The Team Planner is the resource driven tool for scheduling work. (click on image to enlarge)


The Gantt Chart is the task driven tool for scheduling work. (click on image to enlarge)


Now you can schedule work YOUR way!